
Problem identification and framing yield durable results only when root causes are systematically dissected. Merely treating symptoms is akin to administering painkillers: it brings temporary relief without curing the underlying affliction. This chapter presents the comprehensive Simprago toolkit for root-cause analysis, creative ideation, and action prioritization.
Ishikawa 6M Fishbone & The Whys Technique
Skills, training, fatigue, alignment
Wear, equipment failure, calibration
SOPs, workflow bottlenecks, policy
Part quality, specs, supplier drift
Gauges, test accuracy, calibration
Temperature, humidity, culture
1. Brainstorming - Golden Rules, Execution, and Barriers
Brainstorming is an agile, collaborative method designed to analyze challenges and generate a large volume of inventive solutions by tapping into group intellect without premature constraints.
The Five Golden Rules of Brainstorming:
• Rule 1: Strict Prohibition of Criticism - Judgment, sarcasm, and immediate dismissal of ideas are banned to maintain psychological safety and foster boldness.
• Rule 2: Free-Wheeling Ideation - Participants are encouraged to suggest unconventional, radical, and seemingly impossible ideas, as breakthrough innovations often spring from unconventional angles.
• Rule 3: Quantity Over Quality - The initial phase prioritizes the sheer volume of ideas; the wider the pool, the higher the probability of identifying extraordinary solutions.
• Rule 4: Accurate Capture - Every idea is recorded verbatim without managerial alteration, truncation, or editorial filtering.
• Rule 5: Cross-Pollination and Development - Once ideation closes, the team refines, synthesizes, and combines concepts into robust solutions.
Four Destructive Obstacles to Avoid: Cognitive tunnel vision (assuming the status quo is optimal), ridicule, premature evaluation, and knee-jerk rejection under the pretext of standard operating procedures.
Never activate analytical filters during divergent thinking. True creativity requires unrestrained mental freedom; rigorous screening belongs strictly to subsequent phases.
2. Cause and Effect / Ishikawa Fishbone Diagram
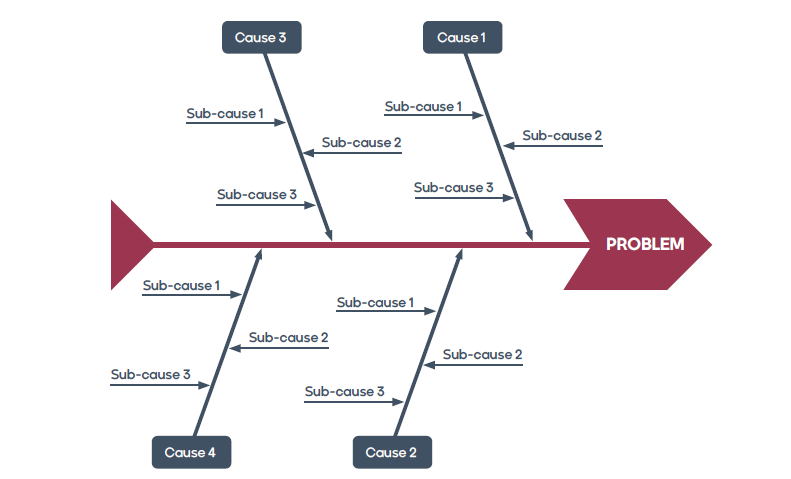
Developed by Kaoru Ishikawa, the Fishbone Diagram is an analytical framework designed to uncover root causes and structure solutions.
Step-by-Step Methodology:
1. Problem Statement: The verified defect or effect is anchored at the head of the main spine.
2. The 6M Primary Bones:
• Man: Personnel competencies, training, ergonomics, and communication.
• Machine: Machinery, tooling, software, and preventive maintenance.
• Material: Raw inputs, technical specifications, and storage.
• Method: Standard operating procedures, sequence of operations, and workflows.
• Measurement: Calibration, metrology instruments, and sensory evaluations.
• Environment: Physical workspace conditions, temperature, lighting, and cultural climate.
3. Populating and Synthesizing: The chart can be populated individually or collaboratively. Duplicate factors are consolidated, and vital roots are prioritized using Pareto analysis.
3. The Comprehensive Six Factors (6M) Audit Checklist
To ensure comprehensive investigation, Simprago employs a 55-question diagnostic checklist covering all 6 dimensions:
• Man: Competency qualifications, procedural adherence, training adequacy, vigilance, motivation, physical well-being, and inter-team relations.
• Machine: Equipment capability, calibration schedules, preventative maintenance rigor, unplanned downtime, and acoustic/vibrational anomalies.
• Material: Composition accuracy, transportation handling, shelf-life verification, FIFO discipline, and supplier quality standards.
• Method: Workflow clarity, operating manual accessibility, cycle times, upstream/downstream continuity, and interface handoffs.
• Measurement: Operator measurement proficiency, gauge repeatability and reproducibility (GR&R), sensor resolution, and subjective bias elimination.
• Environment: Ergonomic layouts, ambient temperature and lighting, hazardous material containment, and 5S workplace organization.
Every negative response within this 55-question checklist serves as a direct indicator pointing to latent organizational vulnerabilities.
4. The Whys Technique (Whys) - Drilling Down to Latent Drivers
The Whys technique interrogates causality across sequential layers without being artificially constrained to 5 questions, piercing superficial symptoms to reach core origins.
Industrial Case Study - Repeated Mechanical Failure:
1. Why did the machine stop? -> The electrical fuse blew from an overcurrent surge.
2. Why was there an overload? -> Insufficient lubricant reached the main shaft, causing extreme friction.
3. Why did lubricant fail to circulate? -> The oil pump was incapable of generating requisite pressure.
4. Why did the pump lose pressure? -> The pump drive shaft had suffered severe abrasion.
5. Why was the shaft abraded? -> Metal shavings contaminated the fluid because no filter was present.
6. Why was no filter installed? -> The original engineering schematics omitted the oil filter entirely!
Takeaway: Repeatedly replacing fuses or pumps was a futile symptomatic expense; updating the design blueprint and integrating a filter permanently solved the breakdown.
5. Pareto Analysis (80/20 Rule) & The Financial Pareto
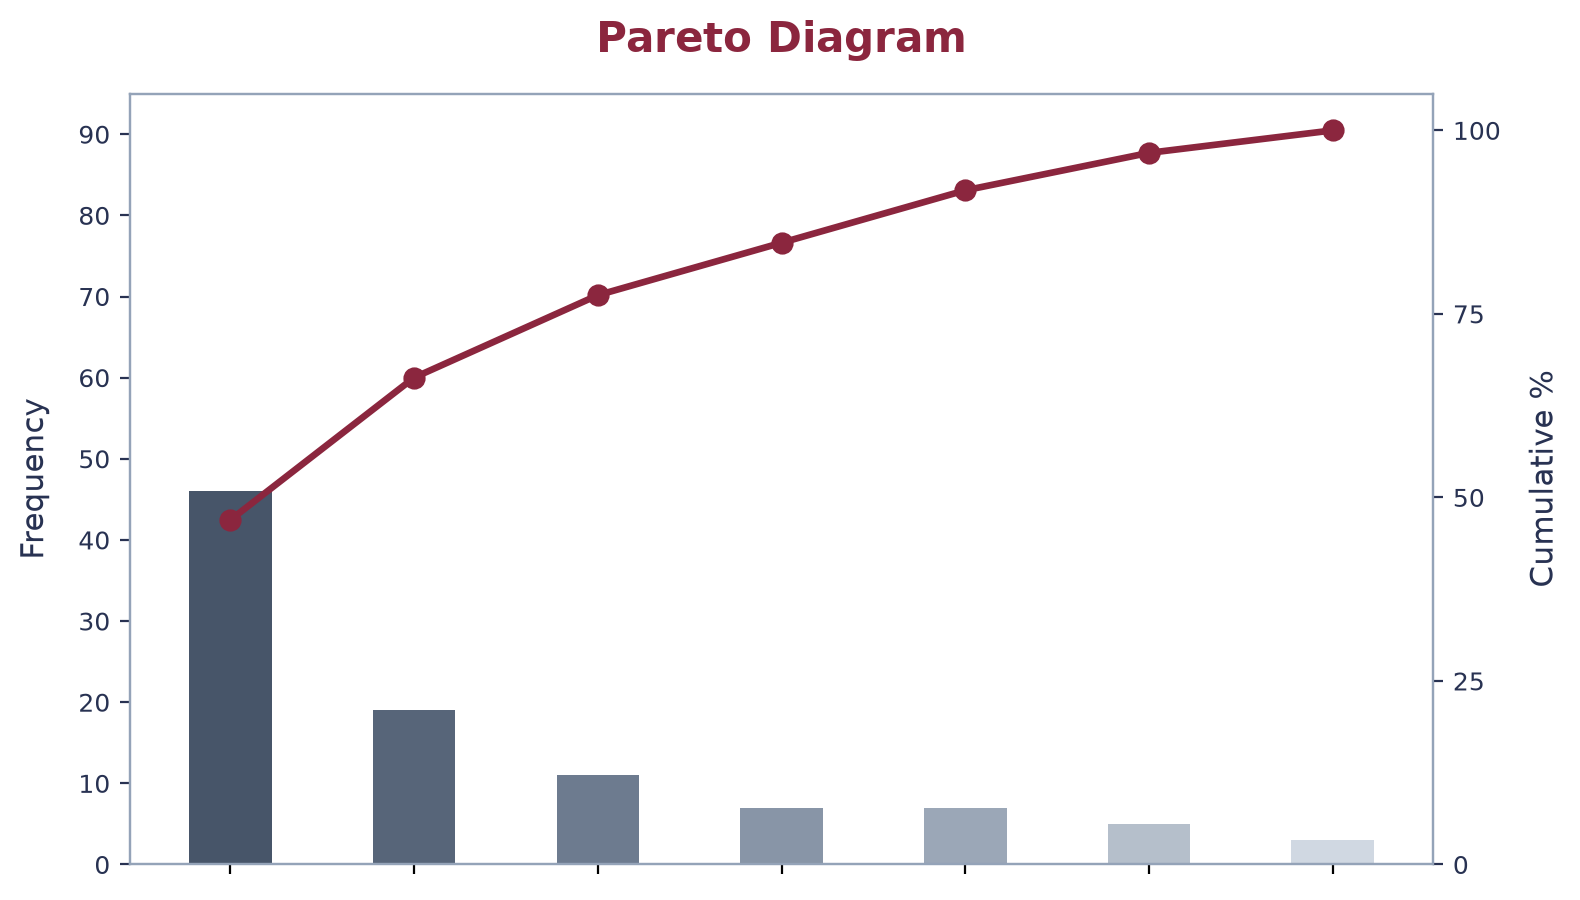
Pareto analysis displays frequency distributions in descending order, accompanied by a cumulative percentage curve.
The Pareto Principle dictates that approximately 80% of defective impacts stem from 20% of critical causes.
Simprago Strategic Paradigm Shift - Financial Pareto:
Standard Pareto charts only highlight frequency of occurrence. However, a high-frequency defect of low financial consequence is vastly overshadowed by rare, catastrophic outages. By plotting a Financial Pareto based on monetary impact, organizations frequently slash recurring operational losses by two-thirds.
6. Failure Mode and Effects Analysis (FMEA)
FMEA is a structured engineering and managerial risk assessment tool adapted within Simprago to rank problem severity and evaluate countermeasure efficacy.
The Three Scoring Dimensions (Scale 1 to 10):
• Severity (S): Harm caused to operations or end customers (1: Negligible -> 10: Catastrophic safety hazard).
• Occurrence (O): Likelihood of failure mode manifestation (1: <1% extremely rare -> 10: >90% nearly inevitable).
• Detection (D): Likelihood of catching the defect prior to customer impact (1: Automated 100% fail-safe -> 10: Completely unnoticeable).
Risk Priority Number (RPN) Calculation:
RPN = Severity × Occurrence × Detection (Range: 1 to 1,000).
• 1–100: Low risk; routine monitoring.
• 101–500: Moderate risk; targeted mitigation planned.
• 501–1,000: Severe risk; demands immediate engineering redesign and priority allocation.
| Operation | Failure Mode | Failure Effect | Sev | Root Cause | Occ | Current Control | Det | RPN |
|---|---|---|---|---|---|---|---|---|
| Container Design | Dust leakage from chassis | Environmental air degradation | 6 | Improper latch mechanism | 5 | Visual inspection | 4 | 140 |
| Container Design | Severe suction drop | Customer dissatisfaction | 7 | Defective gasket sealing | 7 | Visual gasket check | 6 | 294 |
7. Dynamics and Principles of Team Working in Problem Solving
Modern business complexity has rendered solo problem-solving obsolete. Teamwork harnesses collective intelligence across cross-functional domains.
Key Advantages: Transparent communication, diverse experiential paradigms, enhanced collective ownership, and elevated decision quality.
Potential Pitfalls: Unequal workload distribution (free-riding), destructive internal competition, extended consensus cycles, and groupthink.
Simprago Eight Golden Team Principles:
1. Necessity Threshold: Form a team only when problem scope exceeds single-person bandwidth.
2. Technical Competency: Ensure direct technical proficiency in problem-specific domains.
3. Optimal Sizing: Restrict team size strictly between 4 and 10 members.
4. Phased Flexibility: Reconfigure membership as projects transition from scoping to execution.
5. Function Over Personality: Anchor discourse in empirical metrics rather than organizational politics.
6. Operational Proximity: Ensure every participant directly touches the affected process.
7. Role Transparency: Clearly outline duties, deliverables, and mandates for each contributor.
8. Voluntary Alignment: Cultivate authentic engagement to secure lasting commitment to execution.
8. Practical Chapter Workshops and Exercises
Reinforce analytical mastery through the 19 core exercises across the toolkit:
• Brainstorming Drills: Conduct a 20-minute, 10-idea divergent session; apply Rule 5 to cluster and refine.
• Fishbone Drills: Construct 6M diagrams for real operational bottlenecks; identify 3 sub-causes per spine; develop milestone-driven action plans; evaluate post-remedy stability.
• The Whys Technique Drills: Drill down to root systemic causality on recurring customer claims; design structural redesigns over quick-fix band-aids.
• Teamwork Drills: Establish a 5-person charter with clearly demarcated roles (Facilitator, Domain Expert, Recorder, Sceptic); conduct 360-degree post-mortem retrospectives.
Select one active organizational challenge this week. Assemble a 5-member team and sequentially execute the Fishbone, The Whys Technique, and FMEA matrix workflows.
3 Core Takeaways for Problem Solvers
The 6M fishbone ensures comprehensive coverage across people, systems, and tools.
Drill down with the Whys technique until reaching an underlying process or policy defect.
In brainstorming, volume matters; criticism during divergent ideation is forbidden.
1. Kaoru Ishikawa (1915–1989) was a pioneer of Japanese quality management who introduced Quality Circles and the Cause-and-Effect Diagram.
2. Vilfredo Pareto (1848–1923) formulated the 80/20 distribution, later applied to quality management and industrial engineering by Joseph Juran.
3. FMEA was originally formalized in the late 1940s by the US Military (MIL-P-1629) and subsequently standardized by NASA and the automotive sector.